
Defensible: best long-horizon forecaster in out-of-sample tests, but fails as a structural "law of nature"
ORIGINATED BY Giovanni Santostasi (physics-style derivation); Harold Christopher Burger (log-log regression corridor, 2019)
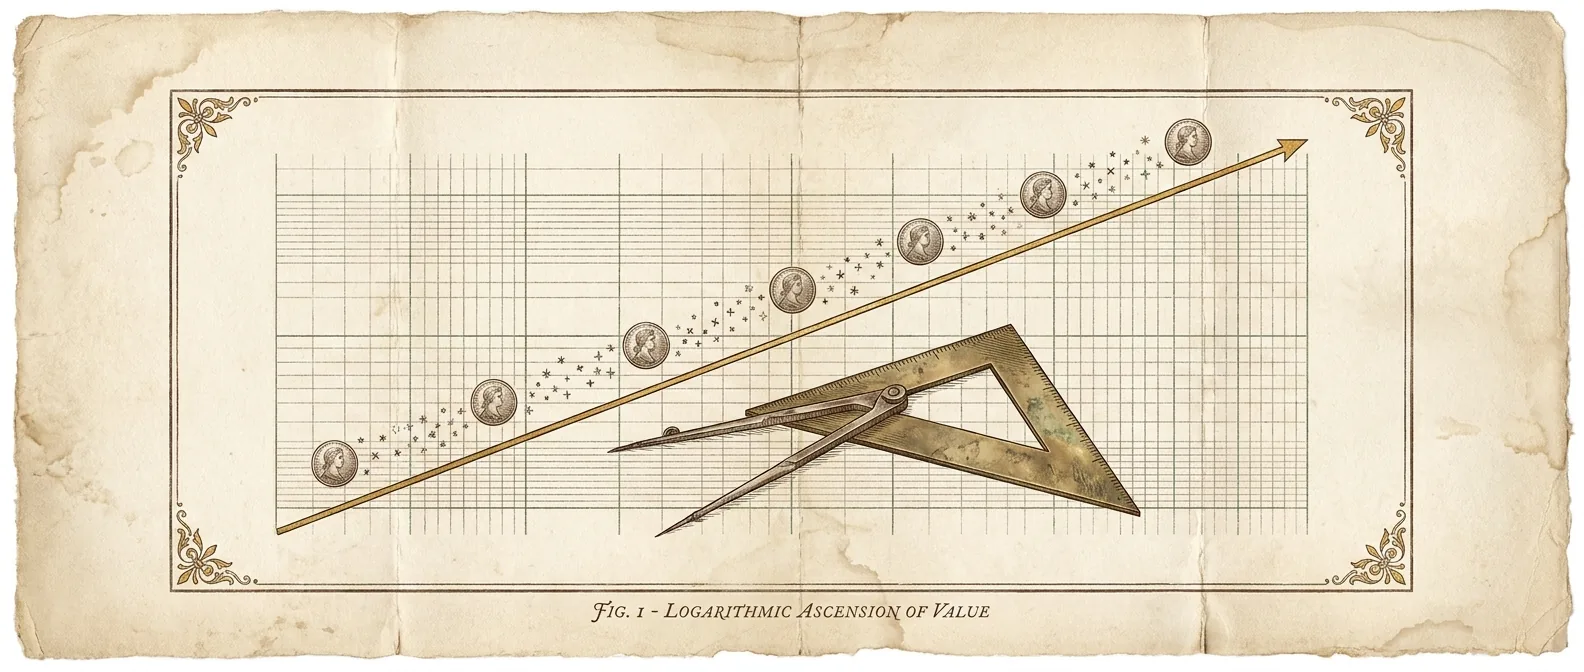
*Plot Bitcoin's entire price history on ordinary axes and you get a demented hockey stick: flat, flat, then a near-vertical cliff. But swap both axes for logarithms and something eerie happens: more than a decade of manias and collapses fall onto a single, patient straight line. That line is the Power Law. To its champions it is a law of nature*, as fixed as gravity. This module argues something more uncomfortable: that the line is real, useful, and almost certainly not a law at all.
The Power Law claims that Bitcoin's price grows as a fixed power of time, not exponentially, not on a fixed cycle, but as a polynomial in the age of the network. On a log-log chart (log price against log time-since-genesis) this becomes a straight line, and the whole of Bitcoin's history, bubbles and crashes included, oscillates around that line inside a broad corridor. Harold Christopher Burger drew the empirical version of this corridor in 2019; Giovanni Santostasi supplied the physics-flavoured derivation that tries to explain why the line should exist.
Santostasi's chain of reasoning is genuinely elegant, which is part of why it seduces. Start with adoption: the number of users grows not as a saturating S-curve but as time cubed, because the difficulty adjustment and ordinary investment risk act as a curbing mechanism: every price surge invites more mining and more competition, which throttles the runaway feedback that would otherwise produce a logistic ceiling. Then apply Metcalfe's law: a network's value scales with the square of its users. Compose the two (value as users squared, users as time cubed) and price comes out proportional to time to the sixth.
The intuition worth keeping is that Bitcoin, in this telling, behaves less like a stock and more like a city or an organism: a self-organising system whose growth is governed by internal structural feedback rather than by earnings, discount rates, or sentiment. Cities obey remarkably clean scaling laws; Santostasi's wager is that Bitcoin does too. If true, the practical payoff is enormous: you would have a rangefinder for fair value at any date, with the bubbles reading as overshoots above the line and the bear-market bottoms as touches of its lower rail.
That is the theory at its most persuasive. It is a single mechanism, it makes a falsifiable shape prediction, and the shape has held across the whole of Bitcoin's history and its four halvings. The question the rest of this module presses is whether the fit is telling us about Bitcoin's physics, or merely about the freedom you have when you get to choose where time begins.
THE MATHS
Users ∝ time³   and   Price ∝ Users²  (Metcalfe)
⟹  Price ∝ (time³)² = time⁶
log(Price) = 6·log(time − t₀) + c   → a straight line on log-log axes
(t₀ = chosen time origin; the exponent depends on this choice)
LIVE READ
The indicator, as it reads right now.
THE HONEST READ · LIMITATIONS
Where this indicator lies to you.
Here is the crack that runs through the whole edifice, and it is fatal to the law claim. A real physical law is shift-invariant: it should not matter where you put the zero of your clock. But the Power Law does. A 2026 arXiv preprint (Baquero & Menezes, arXiv:2605.21316) shows the fitted time-domain exponent swings nearly threefold, from 5.65 when the time origin is set at genesis (s=0) to 16.49 when it is shifted 5,000 days (s=5,000), purely because of the arbitrary choice of where time starts. An exponent that changes by a factor of three depending on a bookkeeping convention is not a constant of nature; it is a fitting parameter wearing a lab coat.
Worse, the diagnostic tests proponents lean on to prove they have found a power law cannot actually do that job. The same paper shows that the standard residual and scale-invariance checks cannot distinguish a genuine power law from a stack of sigmoids, that is, from a series of ordinary adoption S-curves glued end to end. Both produce a convincing straight-ish line on log-log paper and both pass the tests. So the visual seduction of that long, straight line is not evidence of a deep law; it is exactly what you would also see if Bitcoin were living through a sequence of mundane, saturating adoption waves. The eye cannot tell the difference, and neither, it turns out, can the usual statistics.
And yet (this is why the module sits in the defensible tier rather than the cautionary one) the very same simple power law is the best long-horizon forecaster anyone has tested. Out of sample it posts the lowest log10 RMSE at 12, 18, and 24 months (0.375, 0.313, 0.349), roughly half the error of the next-best model at two years and beating every baseline at p<0.05. It only loses at the short end: over 1–3 months a naive 'tomorrow looks like today' baseline wins. The honest verdict, then, is a split. As a claimed structural law of nature, the Power Law fails its most basic test; as a humble, atheoretical rangefinder for where price might sit a year or two out, nothing else does better. Use it as the second thing; never sell it as the first.
“The Power Law trend (plus bubbles) is all that you get. NO MORE, NO LESS.”
“Bitcoin is more similar to a city and an organism than a financial asset.”
THE CITATIONS
Read the sources. Check our work.
FIELD TEST · SIGN-IN REQUIRED
Take the quiz. Track the curriculum.
The module text is open to everyone: no account required to read. The 5-question field test and the curriculum-wide graduation stamp need a free account so we can record your progress.
SIGN IN TO TAKE THE QUIZFREE · NEW ACCOUNT TAKES 30 SECONDS