
Weak: three data points, no mechanism, and a name borrowed from a coincidence
ORIGINATED BY Philip Swift (LookIntoBitcoin)
*Three times Bitcoin has blown off into a mania top, and three times two moving averages kissed within a few days of the peak. The lines are drawn from the numbers 111 and 350, and 350 divided by 111 lands close to π. It is a beautiful result: a chart that seems to know something the market doesn't, wrapped in the most famous constant in mathematics. This module is here to teach you why beauty like that should make you more* suspicious, not less.
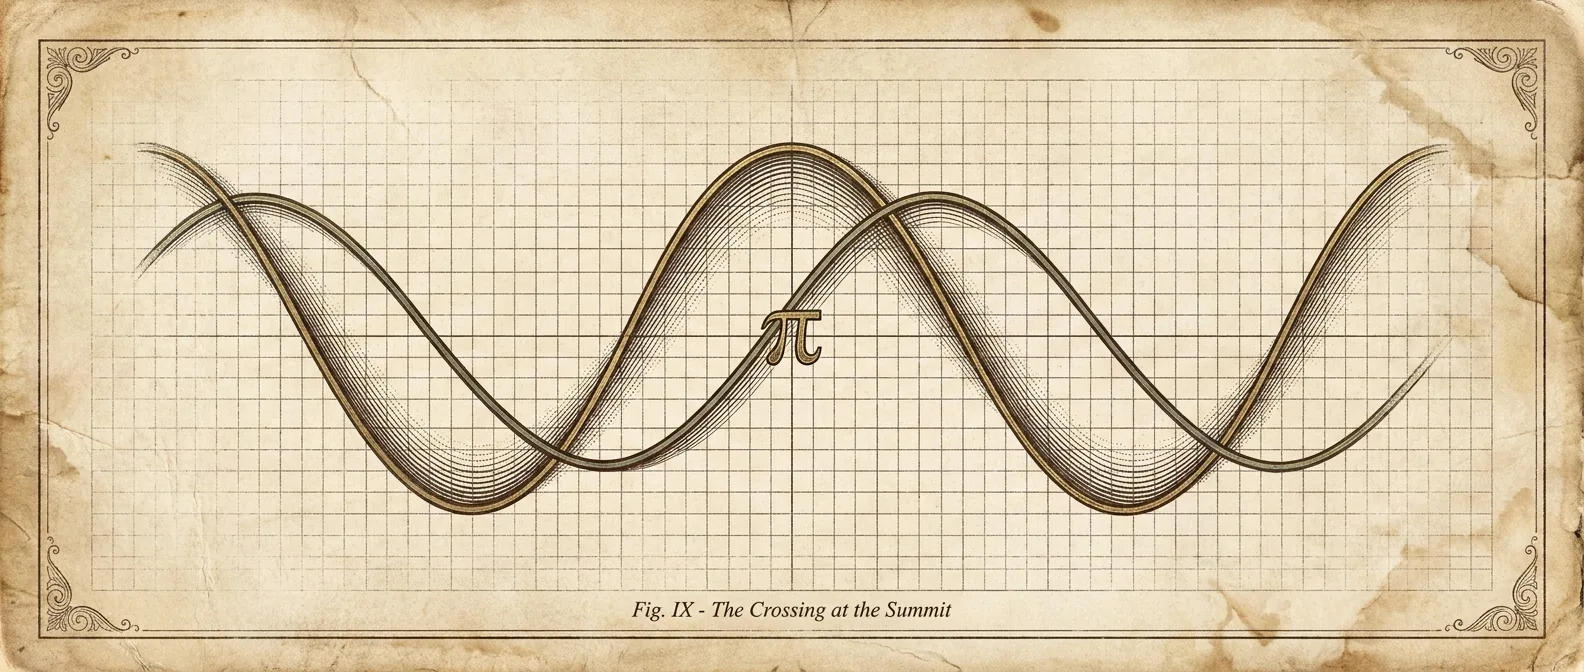
The Pi Cycle Top Indicator plots two lines against Bitcoin's price. The first is the 111-day moving average of price; the second is the 350-day moving average, multiplied by two. Both are ordinary trailing averages: the 111DMA reacts to recent momentum, the doubled 350DMA is a slow, deep baseline lifted onto roughly the same scale as a bull-market blow-off. The signal is a single event: the moment the fast 111DMA crosses up through the slow 2×350DMA.
The intuition its author offers is a momentum-exhaustion story. A parabolic top is, by definition, a stretch where recent price runs violently ahead of any long-run trend. When the short average catches and overtakes twice the long average, price has moved so far, so fast, that the fast line has lapped a baseline calibrated to sit far above it in normal conditions. In each of the three major cycles (2013, 2017 and 2021), that crossing landed within a few days of the actual top. As a piece of pattern-recognition, that is genuinely striking.
The name comes from arithmetic, not from theory. 350 divided by 111 is 3.153, which sits close to π (3.14159). That is the entire basis for the 'Pi' branding: a coincidence about two chosen window lengths, and nothing to do with why tops form. π does not appear anywhere in the causal chain of a market cycle. It appears because someone divided one lookback window by another and noticed the answer was close to a famous number.
So keep two things separate in your head. There is an observation (the crossover has hugged three tops) and a decoration (the π framing). The observation is real but thin. The decoration is pure aesthetics. Treated as a case study rather than a trading signal, this indicator is one of the best teaching tools in the whole curriculum, because it shows you exactly what an overfit model looks like from the inside: a curve that threads a handful of points flawlessly while offering no story for why it should ever thread the next one.
THE MATHS
Fast line = SMA_111(price)
Slow line = 2 × SMA_350(price)
Signal fires when: SMA_111(price) crosses ABOVE 2 × SMA_350(price)
Namesake: 350 / 111 = 3.153 ≈ π (coincidence, not mechanism)
LIVE READ
The indicator, as it reads right now.
THE HONEST READ · LIMITATIONS
Where this indicator lies to you.
Start with the sample size, because everything else follows from it. The indicator has 'worked' three times: 2013, 2017, 2021. Three. That is not a track record; it is an anecdote told thrice. With n = 3 you can fit almost any pair of round-ish numbers to the tops after the fact and then present the fit as if it were a prediction. The multiplier of two, the windows of 111 and 350: none of these were derived from a theory of market cycles and then tested. They were chosen, with hindsight, to make the lines meet where we already knew the tops were. That is the textbook definition of curve-fitting, and it is why this sits in the toolkit wing with a weak rating rather than beside anything peer-reviewed.
There is no mechanism, and the absence should bother you more than any statistic. A good indicator tells you a causal story (cost basis, supply held at a loss, realised value) that would still make sense if you'd never seen the chart. Pi Cycle offers none. Why 111 and not 110 or 120? Why exactly double the 350? Why should the ratio of two arbitrary lookback windows resembling π mean anything at all? There is no answer, because the numbers were reverse-engineered from the outcome. The π connection, the thing that gives the indicator its memorable name and half its persuasive power, is aesthetic coincidence dressed as insight. Dressing coincidence as insight is precisely the trick you are here to learn to see through.
Out of sample, the honest expectation is regression toward uselessness. As Bitcoin's cycles lengthen, flatten, or decouple from the four-year halving rhythm that the training tops all shared, a signal tuned to three past parabolas has no reason to keep landing on future ones, and no theory to fall back on when it drifts. It may fire early, fire late, fire on a local high that isn't the top, or not fire at all. Use it, if at all, as one weak prior among many and never as a trigger. The real lesson of the Pi Cycle Top is not when to sell, but how a chart can fit the past perfectly, explain nothing, and still feel like knowledge.
THE CITATIONS
Read the sources. Check our work.
FIELD TEST · SIGN-IN REQUIRED
Take the quiz. Track the curriculum.
The module text is open to everyone: no account required to read. The 4-question field test and the curriculum-wide graduation stamp need a free account so we can record your progress.
SIGN IN TO TAKE THE QUIZFREE · NEW ACCOUNT TAKES 30 SECONDS