
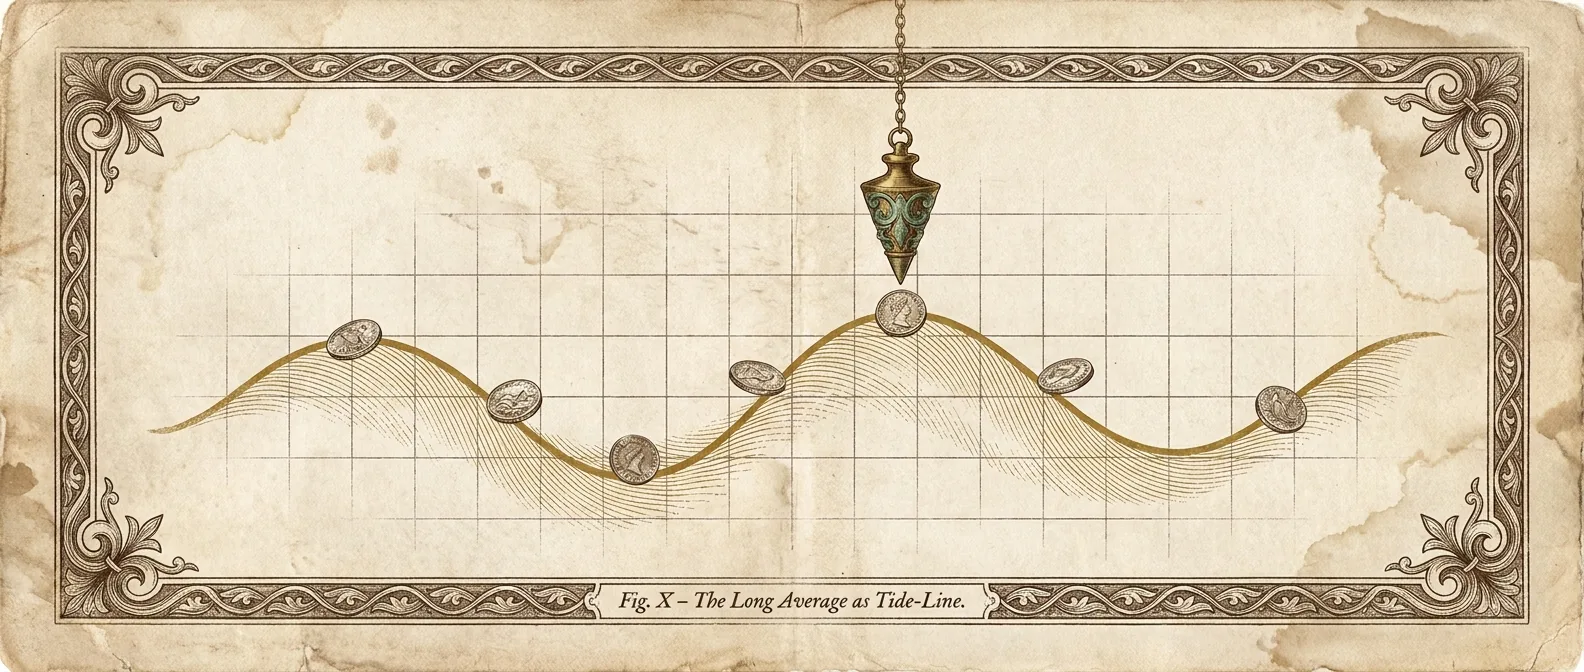
Practitioner heuristic: a plain moving-average ratio with no paper. Robust because it has no hidden parameters, blunt because it lags and rests on ~3 cycles
ORIGINATED BY Trace Mayer
*There is no theory of value here. No spent-output age, no realised cap, no thermodynamic cost of a hash. Just a price, divided by its own average: the bluntest instrument in the whole toolkit, and one of the few that has never needed a footnote. Trace Mayer noticed that Bitcoin rarely trades far above its 200-day mean without punishing the buyer, and rarely far below it without rewarding the patient. That is the entire idea. Its honesty is that it hides nothing; its weakness is that it knows* nothing.
The Mayer Multiple is simply the current price divided by its 200-day moving average. When the multiple is 1, price sits exactly on its long trend. Above 1, price is stretched above trend; below 1, it has fallen beneath it. Trace Mayer's observation was that these stretches mean-revert: historically a reading above roughly 2.4 has flagged froth (the zone from which drawdowns tend to follow), while a reading below 1 has flagged value, the zone from which patient buyers have historically been rewarded. Nothing in the construction is fitted to on-chain behaviour; it is a pure price-derived over/under-extension gauge.
The intuition is the oldest one in trend-following. A moving average is a slow, smoothed estimate of 'where price has been'. Fast-moving price that sprints far ahead of that estimate is, almost by definition, unsustainable in the short run: momentum outruns the base, and the ratio between the two tells you by how much. The 2.4 and 1.0 lines are not derived from any model of Bitcoin's worth. They are empirical guide-rails, read off the historical distribution of the ratio: extreme readings have historically been followed by reversion toward the mean.
The 200-week moving average is the same idea pointed at a far longer horizon: where the 200-day tracks the froth of a single move, the 200-week traces the slow spine of the entire multi-year cycle. Its notable empirical property is that price has only briefly dipped below it, and only near the deepest bear-market bottoms. In practice it has behaved like an approximate cycle floor, a line the market has tested at its most despairing and then climbed back above. That is why it earns a place in the toolkit alongside its faster cousin: one gauges the ceiling of a rally, the other has roughly marked the floor of a bear.
The virtue that binds both is the same: no hidden parameters. There is no cost-basis assumption, no dormancy curve, no cointegration, no coefficient someone chose. A moving average is a moving average; anyone can reproduce it from a price series in a spreadsheet, and there is nothing to quietly overfit. In a field crowded with elaborate on-chain constructions, that transparency is a genuine feature.
THE MATHS
Mayer Multiple = Price / MA_200day(Price)
  Froth zone: MM ≳ 2.4     Value zone: MM ≲ 1.0
Cycle-floor gauge = MA_200week(Price)   (price has only briefly closed below it)
LIVE READ
The indicator, as it reads right now.
THE HONEST READ · LIMITATIONS
Where this indicator lies to you.
Both are lagging by construction. A moving average is a rear-view mirror: it smooths past prices, so it turns after the market does, not before. In a genuine regime change (a first-ever move, a structurally different cycle), the average is exactly the thing that will be slowest to notice. The Mayer Multiple can only ever tell you that price is stretched relative to where it has recently been, never whether 'recently' is still the right reference at all.
The floor claim rests on survivorship reasoning over a tiny sample. 'The 200-week has always held' is a statement about roughly three cycles of a single asset that has, so far, always eventually recovered. That is not a law; it is an observation that has not yet been falsified. An n of ~3 cannot distinguish a real structural floor from a line that simply happened to hold. And the one time a purported floor breaks decisively, everyone who sized a position on 'it has always held' discovers what survivorship bias costs. The thresholds themselves (2.4, 1.0) are read off the same short history and carry the same fragility: they are descriptive of the past, not predictive guarantees.
Finally, the indicator's honesty is also its ceiling. Because it embeds no theory of value (no on-chain data, no notion of cost or holder behaviour), it cannot explain why a level should matter, only that historically it has. That makes it a useful, reproducible sanity check on how stretched price is, and a poor foundation for conviction. Treat it as a blunt thermometer, not a forecast: it tells you the temperature of the current move, never what the weather will do next.
THE CITATIONS
Read the sources. Check our work.
FIELD TEST · SIGN-IN REQUIRED
Take the quiz. Track the curriculum.
The module text is open to everyone: no account required to read. The 4-question field test and the curriculum-wide graduation stamp need a free account so we can record your progress.
SIGN IN TO TAKE THE QUIZFREE · NEW ACCOUNT TAKES 30 SECONDS