
Peer-reviewed (Elsevier, 2026): best-validated on-chain cycle signal, but in-sample, three trades
ORIGINATED BY Z-transformation widely attributed to the pseudonymous analyst 'Awe & Wonder', built on the MVRV framework of Mahmudov & Puell (2018)
*Almost every on-chain "indicator" is folklore: a suggestive line drawn on a chart, celebrated when it works and quietly forgotten when it doesn't. The MVRV Z-Score is the rare exception. In 2026 a genuinely peer-reviewed study in an Elsevier finance journal put the on-chain toolkit through three full market cycles and named the Z-Score the best* performer, lifting a portfolio's Sharpe ratio from 0.45 to 1.28. That is real academic validation. It is also, as the same authors insist, a single-asset backtest resting on exactly three trades. Both things are true. This module holds them together.
The MVRV Z-Score measures how far Bitcoin's market value has stretched away from its realized value, in units of its own historical volatility. Market value (MV) is the familiar number: price multiplied by circulating supply. Realized value (RV) is subtler and more interesting: it prices every coin not at today's quote but at the price it last moved on-chain, then sums those. RV is therefore an aggregate cost basis for the entire network: roughly what the market, in total, paid for its coins. The gap between the two is unrealized profit sitting in the system.
The intuition is behavioural. When MV towers far above RV, the average holder is sitting on a large paper gain: the conditions under which people take profit, euphoria peaks, and tops historically form. When MV sinks toward or below RV, the average holder is underwater, capitulation has done its work, and the network is priced near what it collectively paid: the conditions under which bottoms historically form. Raw MVRV captures this ratio, but it drifts and its extremes shift over time. The Z-Score's contribution is to standardize the gap: divide (MV − RV) by the standard deviation of market value, turning a wandering ratio into a comparable statistical distance from the mean.
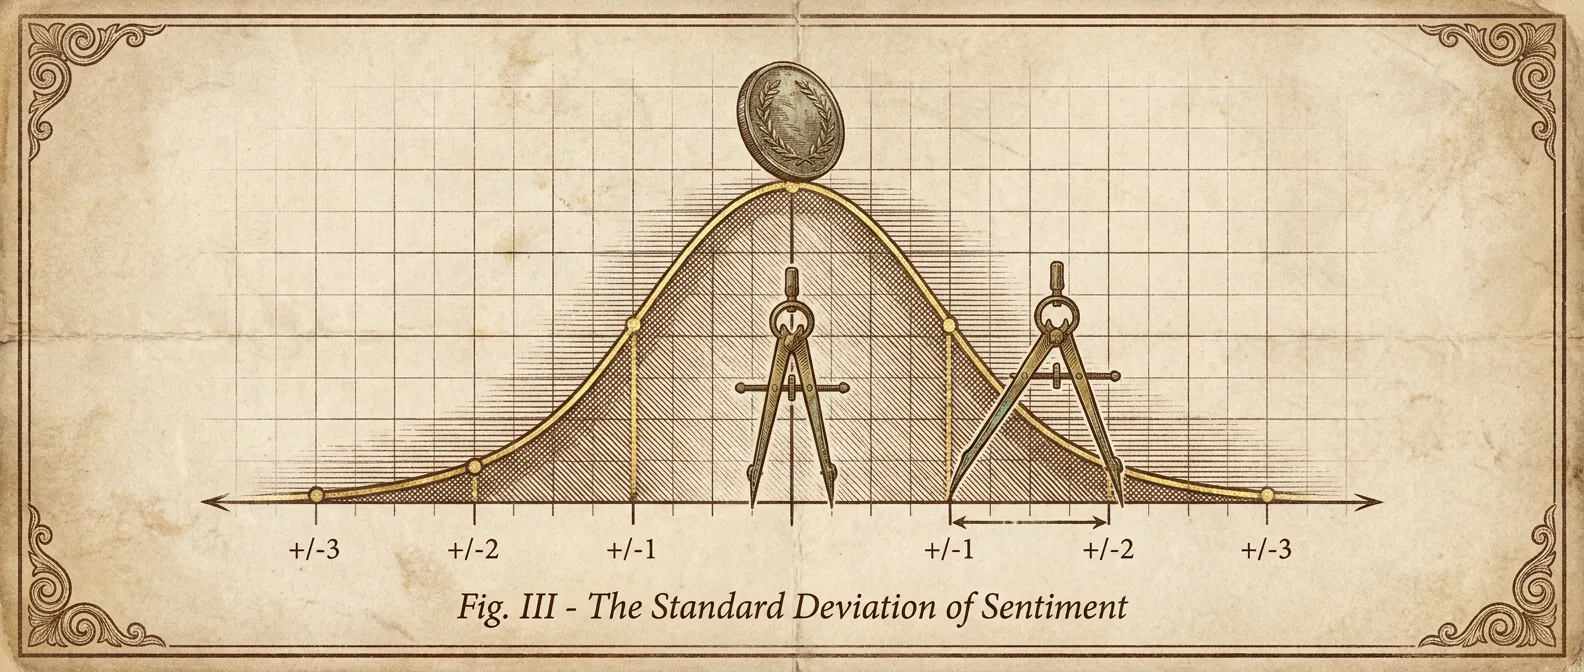
That standardization is the whole idea, and it is why the indicator has a genuine claim on the word 'rigorous'. A Z-score is a well-defined statistical object: it says how many standard deviations an observation sits from its centre, and applied here it converts 'Bitcoin looks expensive' from a vibe into a number you can threshold. Historically, very high readings have clustered near cycle tops and very low readings near cycle bottoms, which is exactly what a mean-reversion trader wants from a signal.
The lineage matters. The underlying MVRV framing is credited by the study to Mahmudov and Puell (2018); the Z-Score transformation on top of it is widely attributed within the on-chain community to the pseudonymous analyst 'Awe & Wonder'. None of this originated in academia; it grew out of the on-chain analyst community. What changed in 2026 is that Grobys, Näsman and Sandretto subjected it to a proper out-of-community test: three full cycles, 2013–2025, benchmarked against buy-and-hold and other on-chain strategies, with statistical significance assessed under Opdyke's (2007) test for Sharpe-ratio differences. The Z-Score won. Its most aggressive variant raised the Sharpe ratio from 0.45 (buy-and-hold) to 1.28; gentler variants scored 1.01 and 1.19. The improvements were statistically significant. That is the strongest empirical result any Bitcoin cycle indicator currently holds.
THE MATHS
MVRV Z-Score = (MV − RV) / σ(MV)

  MV  = market value  = price × circulating supply
  RV  = realized value = Σ (each coin priced at its last on-chain move)
  σ(MV) = standard deviation of market value (historical)
LIVE READ
The indicator, as it reads right now.
THE HONEST READ · LIMITATIONS
Where this indicator lies to you.
Read the study's own words before you get excited. The authors are candid that the exit thresholds are not fully objective, and that the creator-proposed levels may reflect hindsight bias (thresholds chosen because they happened to mark past tops), which, in their phrasing, 'potentially reducing the indicators' credibility.' This is the central honesty problem with every calibrated on-chain signal: if a top is declared at a high Z-score because that is roughly where the last tops sat, you have not predicted anything; you have described the past. To their credit, the authors mitigated this with sensitivity checks across three alternative exit thresholds, and the ranking held, so the result is robust to threshold choice, not merely lucky at one number.
Then there is the sample. Each strategy in the study made only three trades in twelve years. Three. A Sharpe ratio built on three round-trips is a fragile object, however favourable: you are estimating a distribution from a handful of points. Worse, this is an in-sample, single-asset backtest: one asset (Bitcoin), one history, fitted and evaluated on the same data. Nothing here is out-of-sample. And most tellingly, the final trade never reached an exit threshold. It remained open at the end of the sample period, meaning the signal that supposedly calls tops did not fire on the most recent cycle. That is not a footnote; it is a live warning that the historical pattern may already be weakening.
Finally, the authors themselves flag the existential risk: AI and large language models could disrupt the very behavioural regularities the indicator depends on. On-chain signals work because human holders act in patterns: panic, greed, cost-basis anchoring. If market participation shifts toward algorithmic and machine actors, the reflexive human psychology that gives (MV − RV) its predictive edge may simply dissolve. The honest verdict: the MVRV Z-Score is the best-validated cycle indicator we have, and that sentence is doing a lot of work carrying how low the bar is. Treat it as one lens on where the network sits in its cycle, calibrated on a past that may not repeat, never as a trade trigger.
“The thresholds proposed by metric creators may reflect hindsight bias, potentially reducing the indicators' credibility.”
THE CITATIONS
Read the sources. Check our work.
FIELD TEST · SIGN-IN REQUIRED
Take the quiz. Track the curriculum.
The module text is open to everyone: no account required to read. The 4-question field test and the curriculum-wide graduation stamp need a free account so we can record your progress.
SIGN IN TO TAKE THE QUIZFREE · NEW ACCOUNT TAKES 30 SECONDS